


🚩As indicated by the title of the article, this article is about how to read a dynamometer graph and the points surrounding it. The article addresses questions such as:
- How should the numbers and graphs in the dynamometer be interpreted?
- What factors affect the output numbers of the dynamometer?
- A professional dyno test; What should we pay attention to?
Will be answered.
💬How should the numbers and graphs in the dynamometer be interpreted?
Before we analyze the image below, which is the dynamometer graph of a Volkswagen Jetta, it is better to tell you some general points about dynamometer graphs. Firstly, you should know that we have different dynamometer brands, each of which presents graphs and output numbers in their own specific way. For example, some dynamometer brands generally eliminate initial conditions or do not show AFR (Air Fuel Ratio). Some also separate torque and power graphs and display them in different graphs (exactly the opposite of the graph we have provided below).
Another point is that if you take several different runs, the dynamometer usually displays the runs in different colors and to identify them, it mentions the run number corresponding to each color in front of it, which you can see this information under the graphs of each section.
You can find more information about how the dynamometer works, its different types, and also famous dynamometer brands in the "What is a Dynamometer?" article.
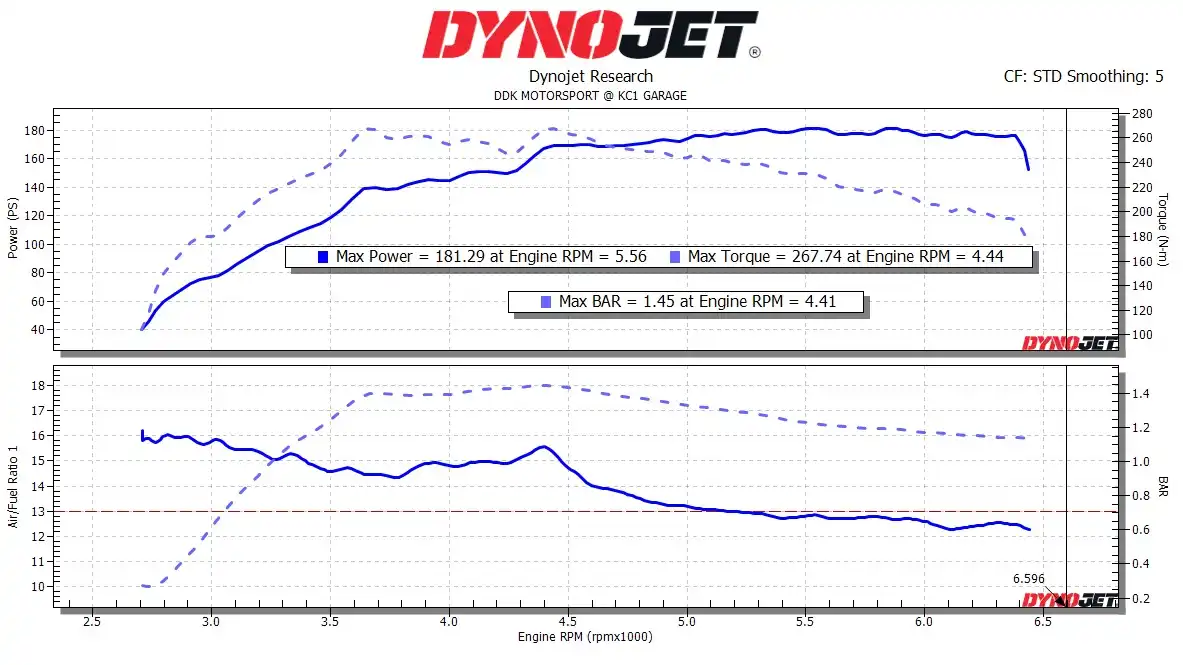
The graph you see in the below image is related to a Volkswagen Jetta (pre-remap run). In this graph, the top chart shows the values of torque and power. The right vertical axis represents torque, the left vertical axis represents power, and the horizontal axis represents engine speed divided by a thousand, meaning the number 6 on the horizontal axis corresponds to an engine speed of 6000 RPM.
❓But how should this graph be read?
As explained in the graph, in the rectangular box, the dotted line graph represents torque, and the bold blue graph represents power. For example, if you want to know the torque at 5500 RPM, start from the number 5.5 on the horizontal axis and move upwards to intersect the dotted line graph. Then, from the point of intersection, move to the right vertical axis to find the torque value, which in this case is approximately 230 Newton-meters. Similarly, for the 5500 RPM, the power is 150 horsepower, which you can easily obtain from the bold blue power graph using a vertical hypothetical line on the left vertical axis.
The same method mentioned above can be used to interpret the two graphs in the lower figure. The vertical axis on the right represents "load," and the vertical axis on the left represents "AFR". In this image, the bold blue line corresponds to the AFR graph, and the dashed line corresponds to the load graph. Using the same method mentioned above, load and AFR can be found for any desired engine speed. For example, at the same engine speed of 5500 RPM, the RPM is approximately 12.9, and the load is around 0.7.
You might wonder what the abbreviation "S.F. (Scaling Factor): STD Smoothing: 5" written in the top right corner of the image means. In fact, this statement means zooming the graph. The number 1 means normal scale (without zoom), and the number 5 means 5 times zoom compared to the 1. This means that the number 5 has a higher precision on the details, but with the number 1, you can see a larger part of the graph on the monitor.
💬What factors affect the output numbers of a dynamometer?
If we take multiple dynamometer tests from a single car with a constant driver, will the torque, power, and other information be the same? The answer is a resounding "no." But why?
The reasons are relatively clear. Many factors affect the output numbers of a dynamometer, and these factors are such that they can even vary from one run to the next.
One of the most expected influencing factors is the weather. To be more precise, humidity, temperature, and the amount of oxygen in the air are among these factors. On colder days (lower temperatures), you will have higher numbers compared to warmer days, as on warm days, wear and friction of components are higher, leading to some energy being lost in these frictions. For example, in terms of humidity, in cities at lower altitudes, air pressure is higher, and vice versa, which in turn affects the car. In general, it can be said that in cities where the oxygen level in the air is higher, with good and precise adjustment, it is definitely easier to achieve higher numbers and power because oxygen is one of the key elements of the combustion triangle and has a direct impact on complete combustion. (Note that, as mentioned, some dynamometers display this information in a corner of the graph.)
Another point in the differences in dynamometer readings is human factors! The driver sitting behind the wheel for the dynamometer test must be skilled and familiar with the car being tested. By doing so, the driver will better understand the power peak points of the car and will show a better and faster reaction when needed, which will result in better numbers in the final result. Therefore, attention to gear ratios, driving mode, and timely gear shifting (in manual transmission cars) will have a significant impact. Although the number of this "negative impact" may not be so noticeable (probably just a digit), it will be significant for enthusiasts of numbers and competitions!
Note that other factors such as how the car is attached to the dynamometer, the dynamometer brand (as mentioned above), dynamometer calibration, and also the type of tires have an impact on the dynamometer test. As you know, tires should work within a defined range of friction for better performance because excessive friction causes excessive wear and low friction causes skidding, which is not only unsuitable for the dynamometer (the tires will not grip the roller) but also dangerous for city and highway driving.
❓But let's talk about "dynamometer calibration". What does this mean and how does it affect the results?
Some factors affecting the dynamometer test mentioned above (such as temperature, humidity, and the like) sometimes cause significant disturbances in the dynamometer output numbers. To reduce the effects of these disturbances and minimize errors in the dynamometer, many dynamometer manufacturers consider correction factors to adjust such variable conditions in the dynamometers. These correction factors are recorded in the dynamometer outputs and automatically applied to the final output numbers. So, the term "dynamometer calibration" refers to the calculations and parameters that the dynamometer manufacturer uses to calculate these correction factors.
💬What should one pay attention to in a professional dynamometer test?
If you want to remap your car and then dyno it, you need at least two dyno runs; one before the ECU ChipTuning and one after. You can also use the subsequent runs to test for error correction and achieve better performance. But the important question is, what should one pay attention to in this process?
One important thing to know at the beginning of this part is that most people only pay attention to the peak numbers of each parameter, which is a mistake. But why? So, what should one pay attention to?
The quick and simple answer to this question is: to compare two dyno runs (before and after tuning), you should pay attention to the area under the graph and the average of the graph, not necessarily the peak numbers. While the numbers are important, for a more precise and scientific analysis and optimal remapping, attention should be paid to finer points.
Look again at the above explanation: as we explained in the first section (and also written on the graph), the maximum torque at 4400 rpm and the maximum power at 5560 rpm have been recorded. The engine speed range from 4400 rpm to 5560 rpm, which is 1160 rpm, is called the "powerband" of the engine. It is better for this range to be as small as possible because this means that while the engine has reached its peak torque and is starting to drop, it continues to produce and increase power and does not drop (in fact, it drops less) until it reaches the peak power. If the powerband range is too large, the engine will choke and have a significant decrease in performance. This is one of the important points that should be paid attention to. This concept (engine powerband) becomes more important when you get dyno run after stage tuning, as aftermarket parts have a significant impact on the peak torque and powerband range (in fact, that's the main job of many of them!). Therefore, after this point, for stage tuning, do not just consider the parts and their appearance, but also consider their performance and how they are adjusted within the power band.
There are also points to consider for turbocharged vehicles. For example, it should be noted that a faster peak torque means the turbocharger must also work faster and come into the circuit to reach the desired peak. So, this direct relationship between turbo boost and peak torque should be taken into account in the ECU tuning performed by the tuner.
📍For more information and probable problems feel free to contact us: support@caracaltech.com